Missing logs for GELF UDP input over AWS NLB
Does your cluster really log everything?
Are you using a Graylog cluster with a GELF UDP input behind a load balancer in your monitoring stack? If so, you're probably irretrievably losing logs (especially the longer ones) and don't even know it!
How it all started?
Recently, my team encountered an issue with missing data being written to Graylog SIEM, which was visible in the application logs.
Initially, it seemed that the missing data was occurring at random intervals unrelated to higher load. We also did not notice any network issues.
Upon further analysis, it turned out that the missing data was most likely from the higher payload and it may be related to the MTU value.
How to reproduce the problem?
The applications whose data was missing used the pygelf library for logging as one of the ones recommended by the Graylog community, so reproducing the problem seemed relatively easy.
| gelf_logging_test.py | |
|---|---|
"Weird, it works for me." What's next?
It was not possible to reproduce the error, so another analysis was needed. This time of the library itself and what is happening in it. At first, two parameters specific to the UDP handler stand out.
chunk_size (1300 by default)- maximum length of the message. If log length exceeds this value, it splits into multiple chunks (see https://www.graylog.org/resources/gelf/ section “chunked GELF”) with the length equals to this value. This parameter must be less than the MTU. If the logs don’t seem to be delivered, try to reduce this value.
compress (True by default)- if true, compress log messages before sending them to the server
Due to the fact that compression of even a gigantic string consisting of just one character is probably extremely effective, it was initially disabled in the handler.
| gelf_logging_test.py | |
|---|---|
Disabling compression also did not cause any errors, so we started testing logs with different chunk_size settings.
The source code contains a comment that the number of chunks cannot be greater than 128.
Even though the logs sent by our applications are not large enough to exceed this limit, we decided to perform tests with different settings of this value.
This test confirmed that indeed the largest message was skipped by the server for the smallest chunk_size values of 100 or 300.
Why?
50 thousand characters divided into pieces of 300 gives us 167 chunks to send, thus exceeding the 128-chunk limit accepted by the server.
Unfortunately, this still does not solve our problem because the logs not actually saved by the server did not exceed this amount.
That's not enough. We have to go deeper!
Looking through the sources we can find the GelfChunkAggregator class responsible for aggregating UDP packets into the original message, which confirms the information contained in the library regarding the maximum number of 128 chunks.
In addition, in line 57 we can find a value defining the time in which all chunks of the message must reach the server. This is confirmed by subsequent fragments of the code of this class.
| GelfChunkAggregator.java | |
|---|---|
After this analysis, we were certain of three things:
- The message cannot be split into more than 128 chunks (we have less because we counted)
- All chunks must be delivered in less than 5 seconds (we deliver in less because we checked)
- We must deliver all parts so that the message can be aggregated (obvious)
Don't assume something is obvious, just check!
Since it was clear that we don't split the message into more than 128 chunks and send them all in less than 5 seconds, I decided to check if the problem isn't somewhere on the network side and some packets aren't reaching their destination (remember, we're working with a UDP connection).
First, I wanted to check how the load balancer record is resolved in the application and whether the problem does not occur when we try to send information between different Availability Zones.
I decided to look at the sources of the pygelf library and check whether it is prepared to log where it sends data in the case of configured logging at the DEBUG level.
| pygelf/pygelf/handlers.py | |
|---|---|
Since the GelfUdpHandler class does not have such options and simply calls the send method on the DatagramHandler object, I decided to go deeper and started browsing the Python sources.
What caught my attention was the fact that the mentioned DatagramHandler during each data write to the socket passes the destination address along with the data, which in our case is in the form of a domain address and not an IP address. In such a situation, the domain address will be converted to an IP address separately for each chunk of the original message. This behavior, in turn, may cause that in some cases chunks of the same message may reach different nodes of the cluster and cause errors.
Which is confirmed on the Graylog community forum here
derPhlipsi Philipp Ruland
Additionally, it should be obvious that the chunks must arrive at the same server for them to get reassembled, else the message will be discarded instantly. So using round robin or similar load balancing will not work.
Knowing how the mechanism for sending individual packets works, I decided to write a simple lambda function that would query DNS many times and return statistics of these queries.
| dns_check.py | |
|---|---|
Another surprise (and if you think about it, it should be obvious) was the fact that Amazon's internal cloud DNS servers do not cache results and each subsequent query returns a different IP address. When querying the DNS server several thousand times in a row, the results are distributed perfectly between all currently available IP addresses.
| dns_check_output.json | |
|---|---|
Wait. Why doesn't sticky sessions work?
The answer to this question is very simple. It does work, but we haven't used it. Why? According to AWS documentation UDP packets are routed to the same target based on the protocol type and the source and destination values.
UDP session stickiness
For UDP traffic, the load balancer selects a target using a flow hash algorithm based on the protocol, source IP address, source port, destination IP address, and destination port. A UDP flow has the same source and destination, so it is consistently routed to a single target throughout its lifetime. Different UDP flows have different source IP addresses and ports, so they can be routed to different targets.
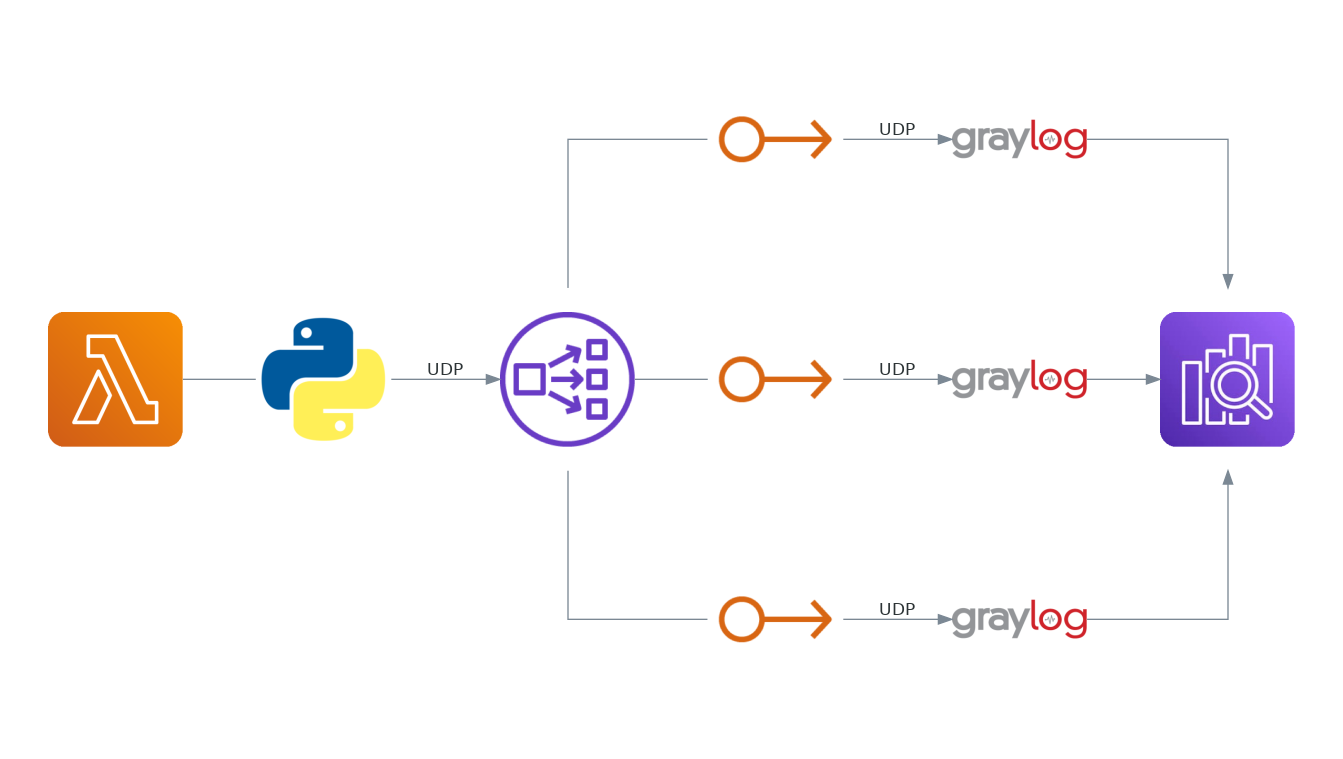
In our case, when sending each chunk of the message, the library asked the DNS server for the IP address of the load balancer, and according to the assumptions, it sent a different address each time to evenly distribute the traffic.
The load balancer, receiving packets from the same source but sent to a different destination, did not qualify them as a single session and directed the traffic to a different node each time. After sending all the message chunks, they were in the buffers of different nodes and none of them was able to aggregate them into the original message.
After 5 seconds, all chunks of the message were abandoned as incomplete and the log record was irretrievably lost.
How to fix it?
There is no single solution to this problem, but we decided to perform several smaller operations that will work for a short time before the target solution is implemented.
Changes in load balancer (instant change)
We decided to use the Availability Zone DNS affinity option, which causes the preferred resolved address for the DNS client to be the one in its Availability Zone. This way, each chunk of the message will be sent to the same node. Unfortunately, we will lose the ability to evenly distribute traffic because all lambdas launched in a given zone will always use the node in the same zone they are in. The benefit is immediate recovery for all applications without any changes to the code.
Changes to the application initialization code (short term workaround)
The next step was to implement a fix by the development teams to the lambda function initialization code to resolve the load balancer address before configuration and restore the load balancer settings to the default configuration. In this way, we improved the reliability of the load balancer itself and improved traffic distribution between cluster nodes. The IP address was not dependent on the zone in which the application was started and was static only for the lifetime of a single lambda function.
Library improvement and logging flow changes (long term solution)
The final step will be to improve the library so that address resolution does not occur at the level of a chunk but the whole message and perhaps change the approach to logging. In this way we will return to the initial configuration where we do not have to remember to properly prepare the configuration for the library and maintain a separate version for correct operation.